Altech Solutions

The Little Engine (TLE)

Find the Root Cause Before an Issue Becomes an Outage

TLE is a decision intelligence layer for your existing monitoring tools. It correlates their alerts into one actionable alert, with the root cause, the affected devices and a recommended action.

Built to integrate with your existing tools
  • Spectrum
  • syslog
  • NetBrain
  • ServiceNow

From Alert Noise to Clear Decisions

How TLE changes day-to-day operations for network and infrastructure teams.

  • Without TLEEach monitoring tool raises separate alerts for the same issue.

    With TLERelated alerts are consolidated into one alert per issue, across every source.

  • Without TLERecurring warnings look identical until a failure occurs.

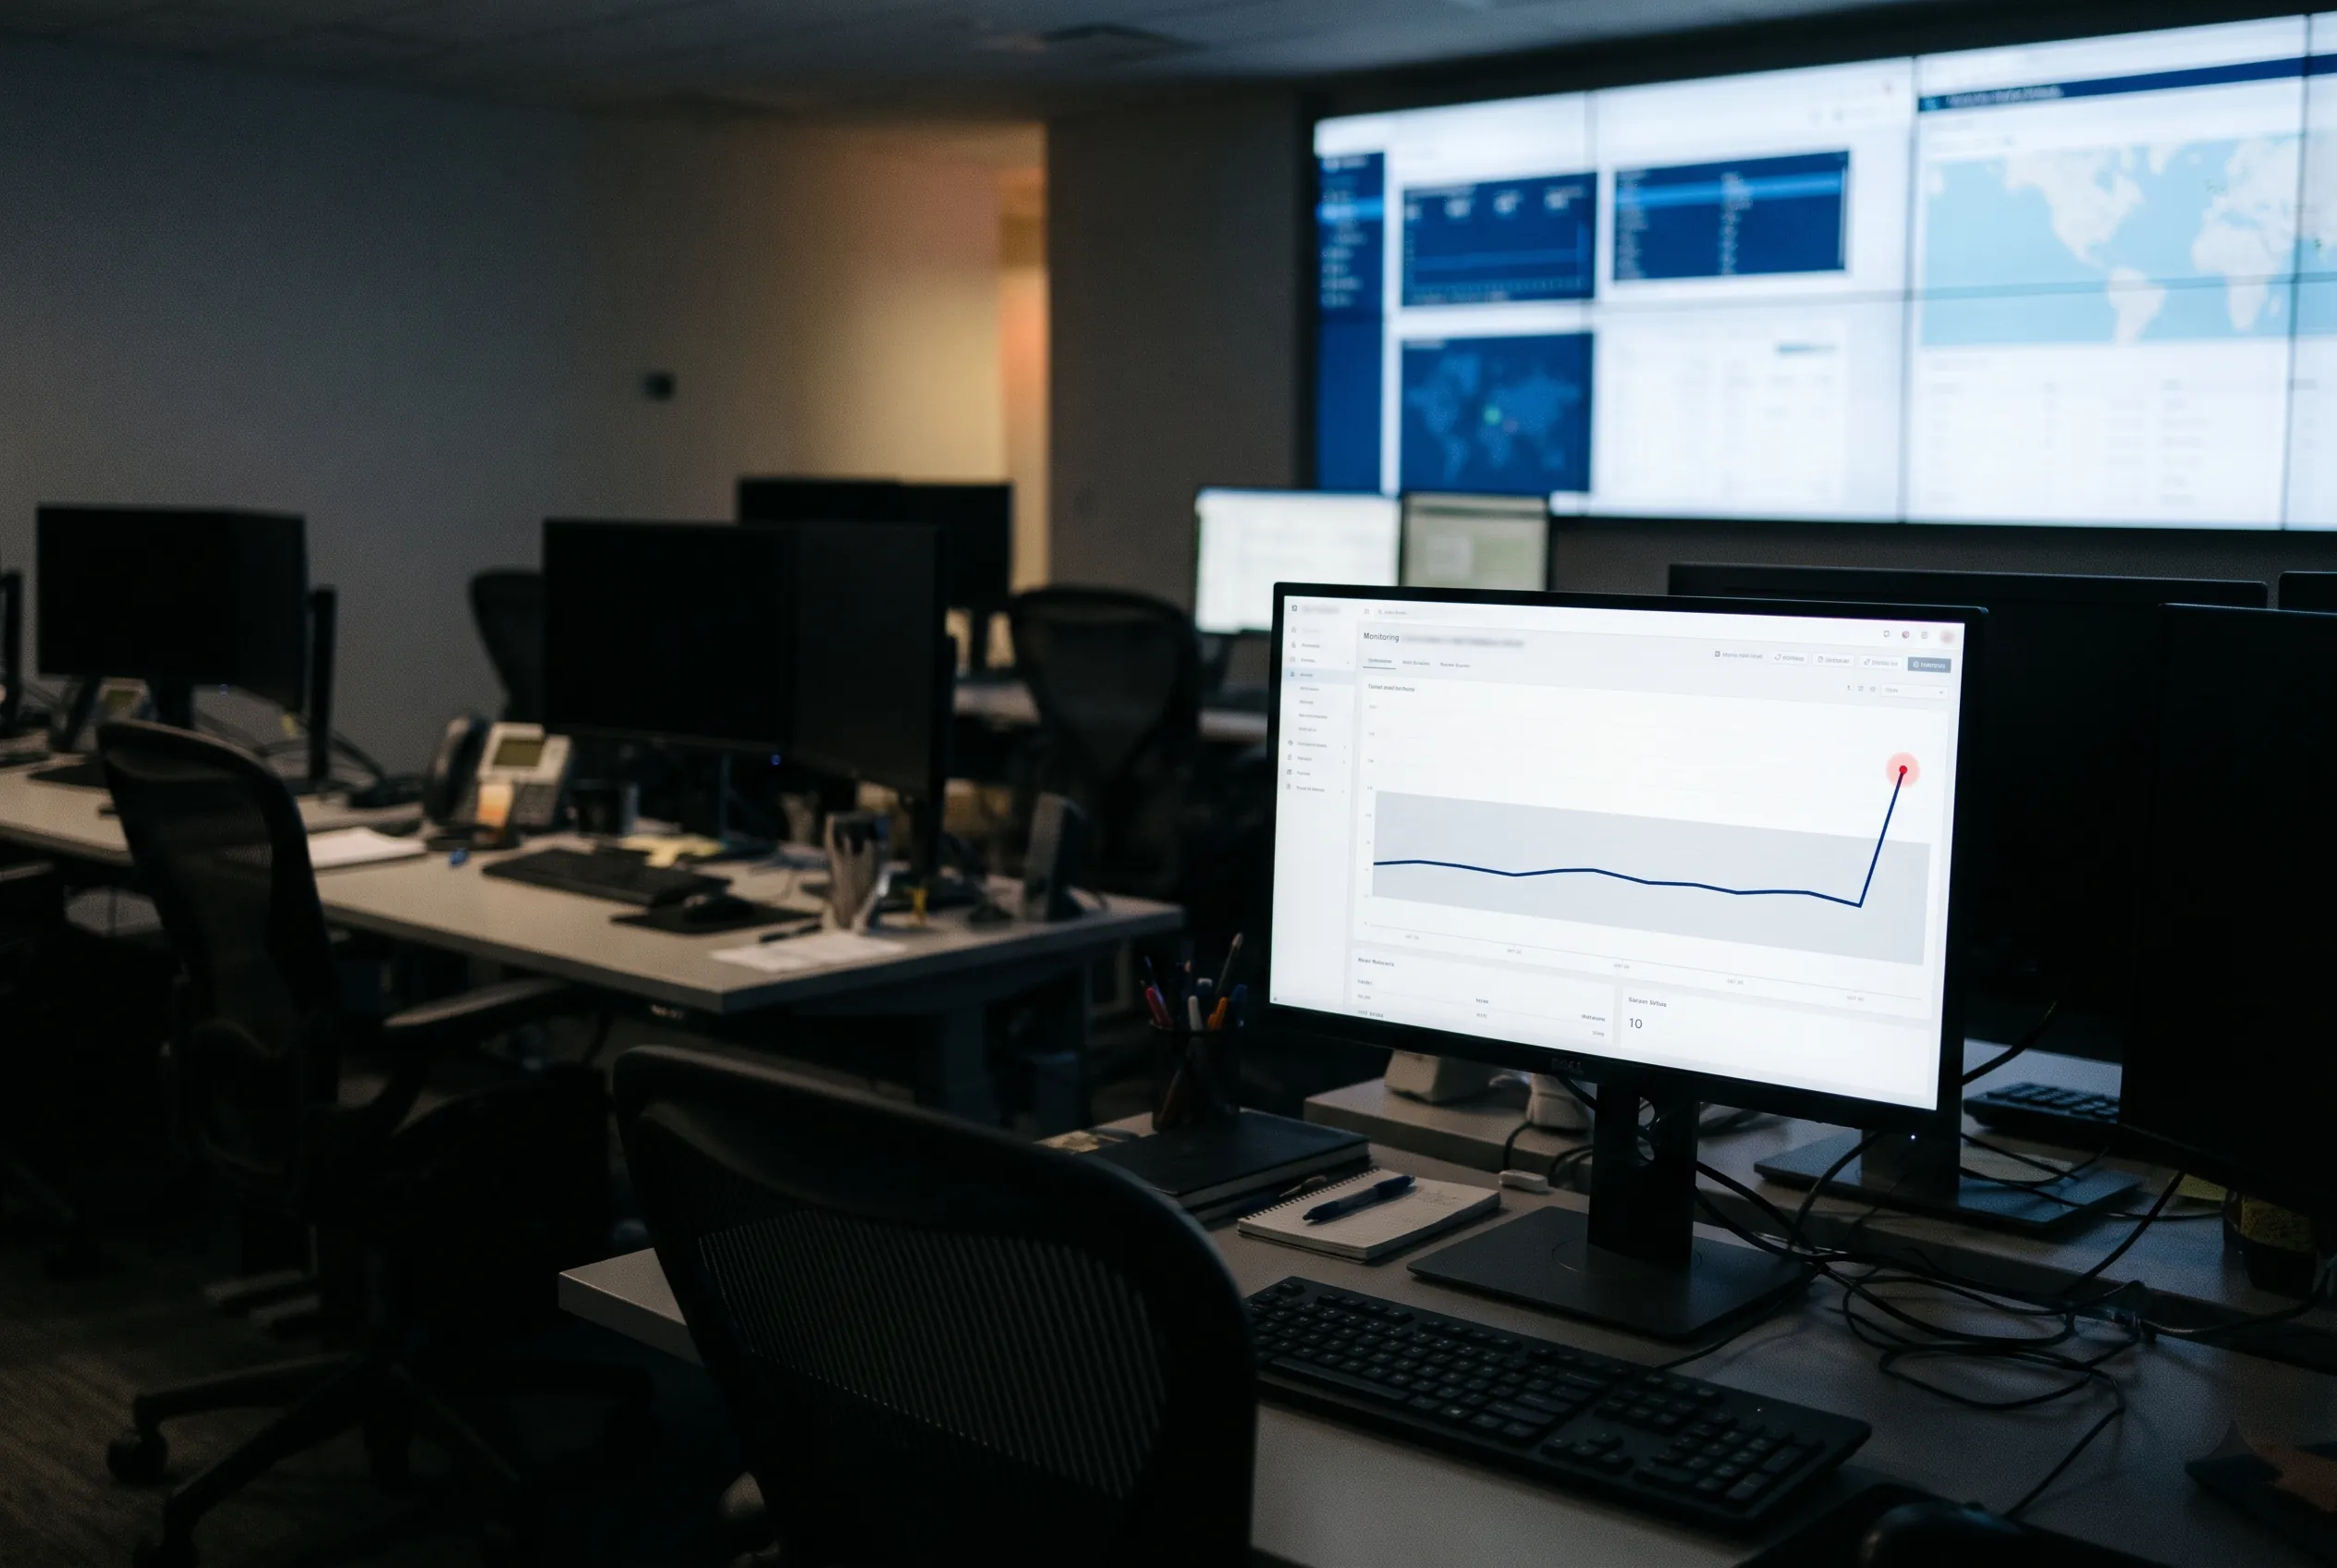
    With TLERisk is flagged in three stages (warning, rising risk, critical) before a failure.

  • Without TLEEngineers must interpret raw alarm codes and log entries.

    With TLEEvery alert includes a plain-language root cause and a recommended action.

  • Without TLEDownstream impact is unclear until systems fail.

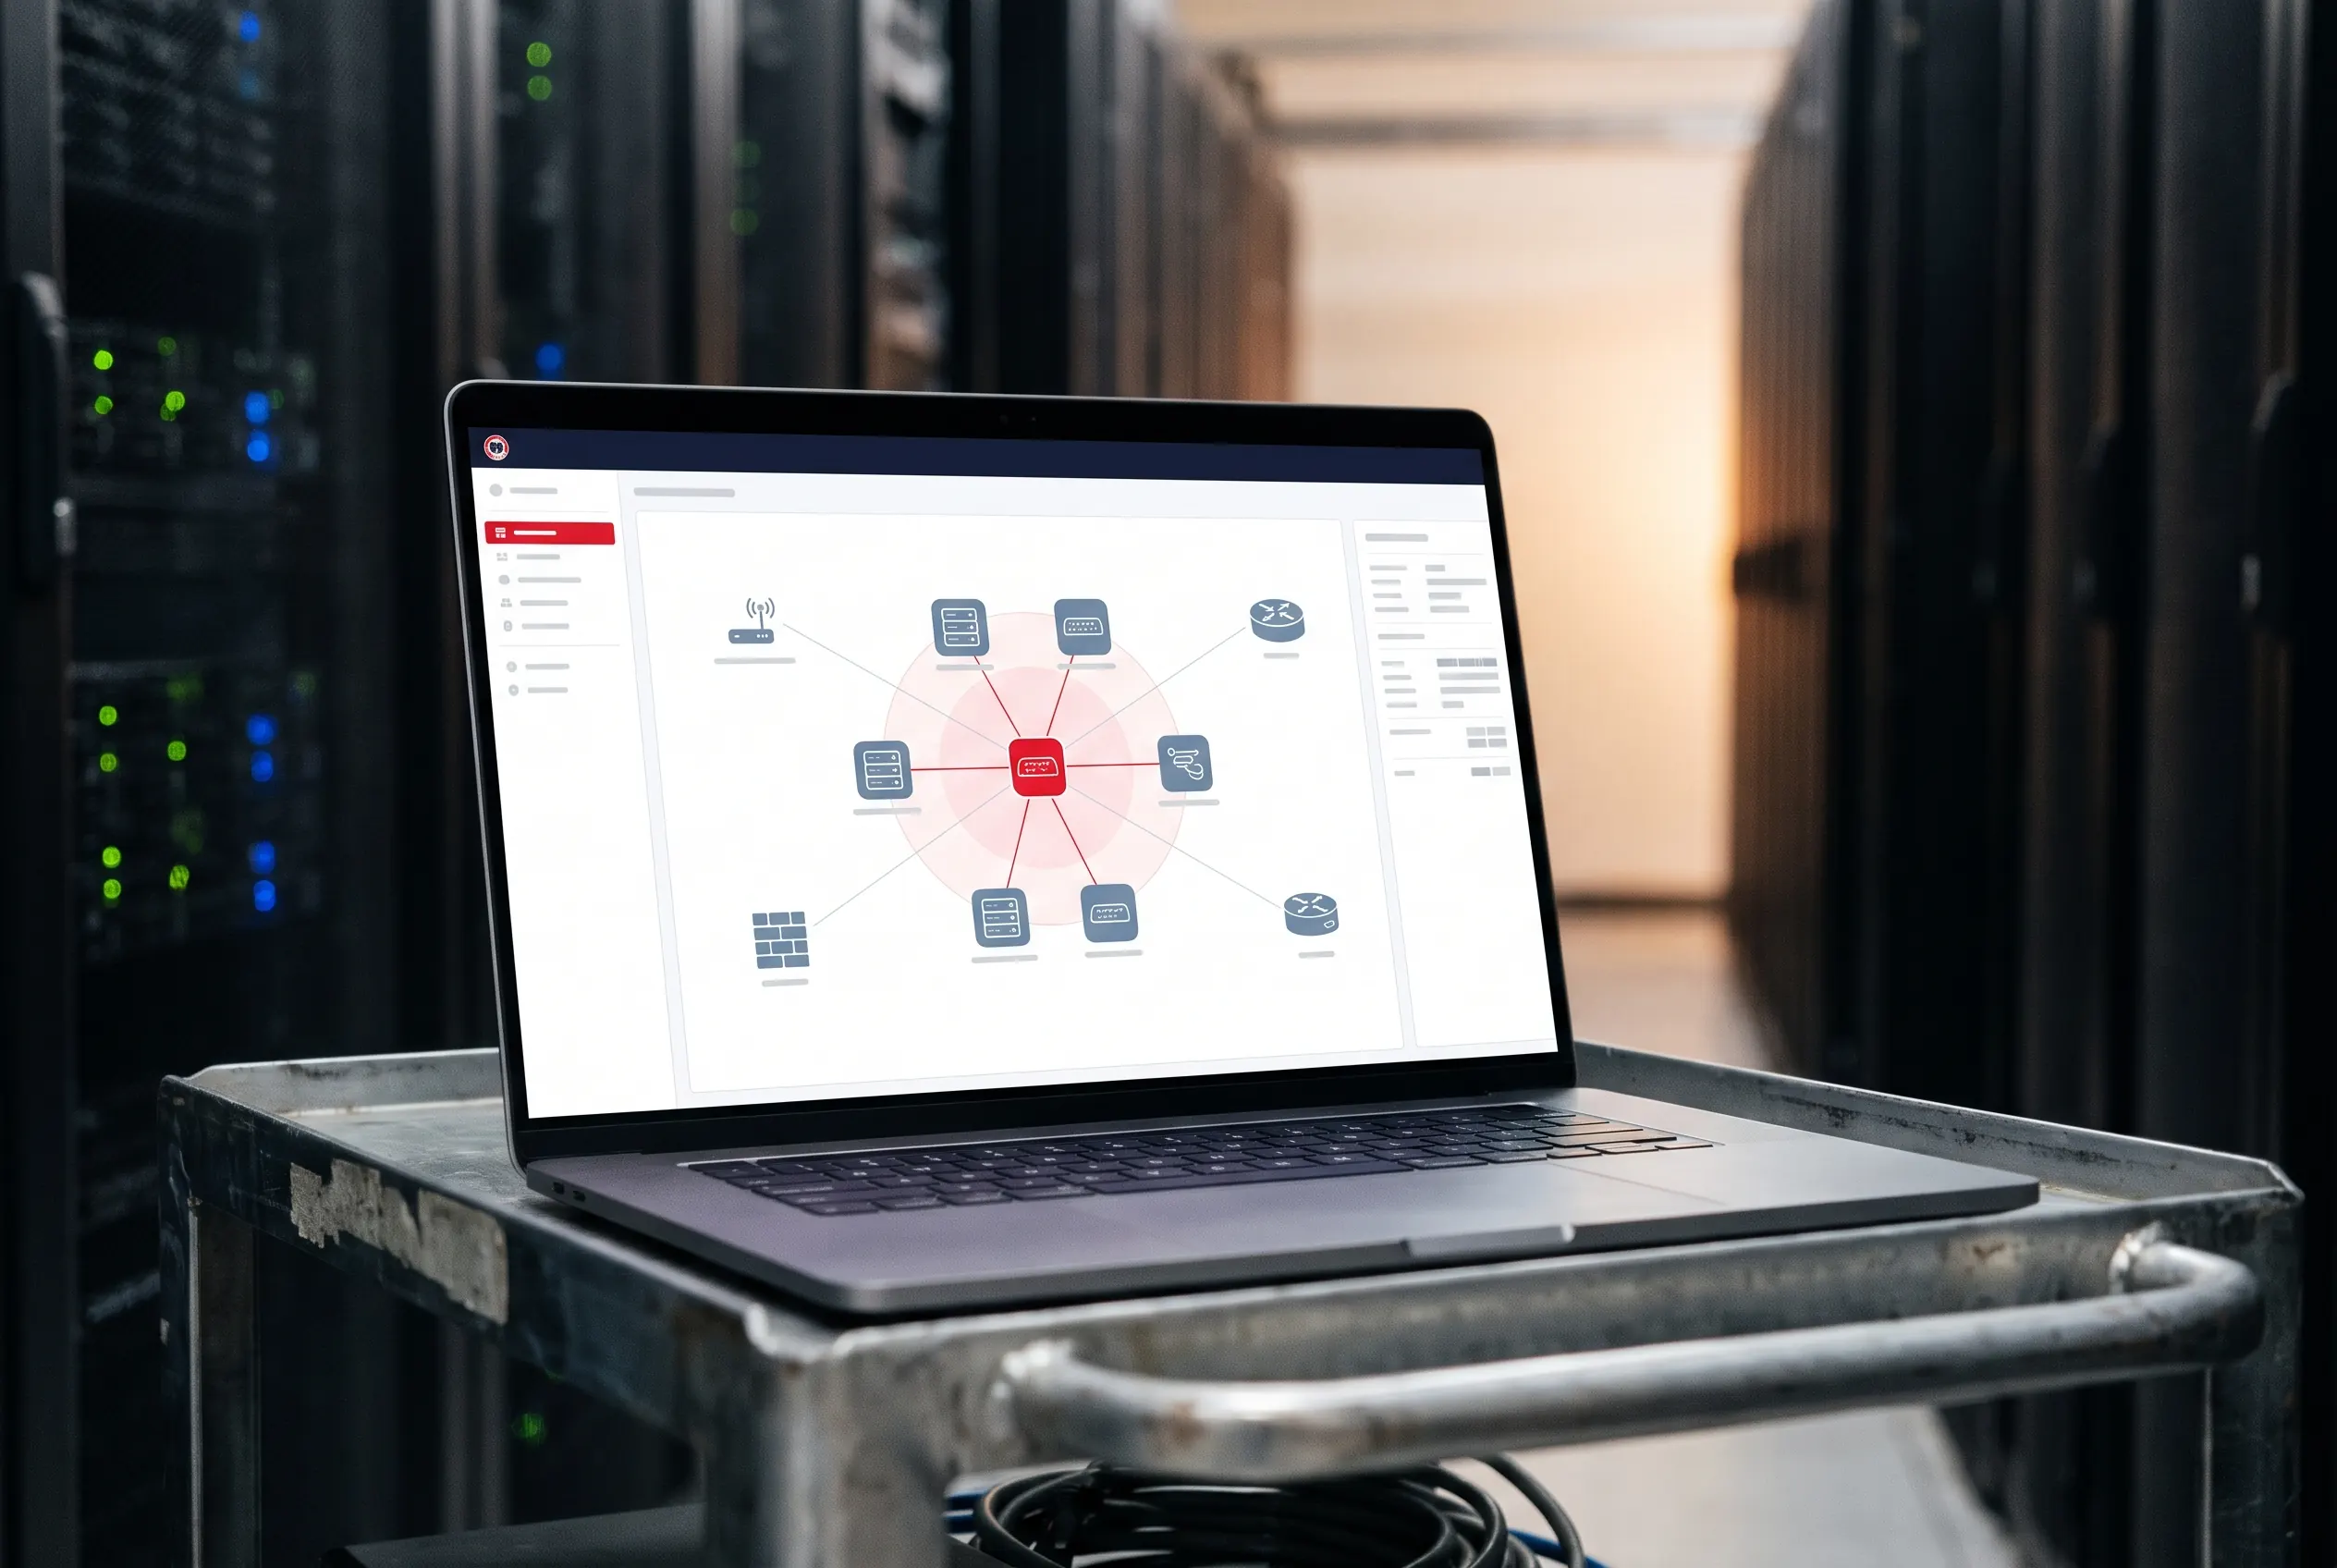
    With TLEAffected devices are mapped automatically, including direct and secondary dependencies.

  • Without TLETickets and incident reports are compiled manually.

    With TLETickets are pre-filled with the correct priority, and incident reports are generated on demand.

TLE in Action

See How TLE Works

A guided walkthrough of the TLE console, from the first warning to the final incident report.

From Signal to Decision in Four Steps

A continuous, agentless process that runs on top of your existing monitoring tools.

How TLE works. Alarms, logs and topology data from your existing tools stream into TLE. TLE correlates the related signals, grades them and explains them, calling its AI model only when a signal deviates from normal. The result is one actionable alert with an alert ID, a ticket, the root cause, the affected devices and a recommended action. An operator acknowledges it, can open the incident report, and escalates the ticket to your ITSM platform only after review.
01Collect
02Correlate03Grade
04Act
  • Network monitoringAlarms from network tools
  • Server monitoringServer and storage alarms
  • Device logsRaw events and error messages
  • Topology dataHow devices are connected
  • Power and coolingUPS and cooling alarms

Uses data your tools already collect. No agents on your devices.

AI modelCalled only on deviation

Decision intelligence layer

CriticalServer room switchP-1
AlertA-000418TicketT-000127Raised 2m ago
Correlated into one alert
AlarmLogTopology3 sources
Root cause

A cooling failure is raising the inlet temperature on the switch.

Impact

8 devices directly connected, including the core switch.

Recommended action

Inspect cooling systems and airflow immediately.

AcknowledgeReportEscalate

Sent to your ITSM platform only after operator approval

  1. Collect

    Ingests alarms, logs and topology data from your existing tools. No agents are installed on devices.

  2. Correlate

    Maps each fault to the affected device and links it to any open alert for the same issue.

  3. Grade

    An AI model assesses the combined evidence and assigns a severity. It is called only when activity deviates from normal.

  4. Act

    Each alert includes its root cause, a recommended action and a ticket. Operators make the final decision.

Production Ready

Core Capabilities

Built into every alert in the TLE console.

Noise Reduction

Cross-Source Alert Correlation

Faults related to the same issue on the same device are consolidated into a single alert, regardless of which tool reported them.

  • Duplicate and repeat alerts are consolidated automatically
  • Related symptoms are identified and summarized in plain language

Proactive Detection

Early Warning and Root Cause Analysis

TLE tracks how an issue develops and escalates it while there is still time to act.

  • Three-stage severity based on all available evidence
  • Plain-language root cause, with time-to-impact where it can be estimated
  • A recommended action and the correct priority for your ITSM platform

Blast Radius

Impact and Dependency Mapping

Each alert shows every device connected to the affected system, directly and one hop away, from the first warning onward.

  • Prioritize by operational impact, not alarm volume
  • Identifies critical dependencies, such as a switch serving an entire server room
  • Based on TLE’s automatically discovered network topology

Human in the Loop

Operator-Approved Ticketing and Reporting

Every alert generates a pre-filled ticket. Operators review and escalate, and TLE produces the incident report.

  • Acknowledgements with notes give clear ownership
  • No ticket reaches your ITSM platform without operator approval
  • An executive summary and a detailed engineering report

Designed for Your Existing Environment

TLE adds a decision intelligence layer without replacing your monitoring tools or changing your devices.

  • Agentless by Design

    TLE uses the data your monitoring tools already collect and works alongside them, not in place of them.

  • Automated Topology Discovery

    TLE builds the network map from your existing tools, from switches to UPS and cooling systems. Missing devices or links can be added manually.

  • Targeted, Efficient AI

    The AI model is called only when a device deviates from its normal baseline, keeping responses fast and operating costs low.

  • Role-Based Access Control

    Devices are assigned to teams, and only the owning team can escalate their tickets.

    • Owner
    • Admin
    • Operator
    • Viewer

Rapid Acquisition-Ready

Commercial-Off-The-Shelf (COTS)

TLE Core Engine qualifies as a commercial item, enabling faster procurement with reduced contracting friction.

OTA & Rapid Prototyping Eligible

Available for Other Transaction Authority awards with accelerated evaluation and a 30-day prototyping cycle.

Proven Federal & NASA Heritage

Built by engineers with deep operational experience from NASA JPL and Goddard missions.

Common Questions

Have a question not covered here? Our team can answer it during your demo.

Does TLE replace our existing monitoring or ticketing tools?

No. TLE is data agnostic: it works as a layer above your existing monitoring tools and takes in alarms, logs and topology data from many sources. It connects only to those tools, never directly to your devices, so nothing is installed on them. It also creates tickets in your ITSM platform with the priority set on that platform's own scale.

Does TLE take any action without an operator?

No. TLE recommends an action for every alert, but it never changes your devices. Each alert gets a pre-filled ticket in TLE, and nothing is sent to your ITSM platform until an operator reviews and escalates it. If an alert is a false alarm, the operator de-escalates it, the ticket is closed and nothing is sent.

Where is our data processed?

That is your choice. TLE works with any locally hosted AI model, so your monitoring data never leaves your network. It can also connect to a hosted AI model through an API. In both cases, only the alarms and log lines related to an issue are sent to the model.

How does TLE decide that something is wrong?

Alarms from your monitoring tools already signal a problem, so TLE has its AI model explain each one in plain language. Log messages with one clear meaning, such as a storage pool nearing capacity, become faults immediately. For all other log activity, TLE compares each device with a baseline set for your environment and calls its AI model only when activity deviates from it. The model explains the issue, sets the severity and recommends an action. Operators can override any severity.

What does a Rising risk alert mean?

It means the evidence of one problem on a device is getting worse, but nothing has failed yet. No fixed number of faults triggers it; TLE weighs how serious the evidence is. If the team acts and fixes the cause in time, the critical failure does not happen. If they cannot fix it in time, they still gain time to prepare, for example by getting a technician on site.

How does TLE know that alerts from different tools concern the same device?

Each monitoring tool identifies devices in its own way. When TLE builds its network map, it matches each device across your tools and merges the records into one. Faults about the same problem on that device then join a single alert, whichever tool reported them. No discovery is complete, so missing devices or connections can be added to the map manually.

How are teams, roles and permissions managed?

Each device belongs to one team, and only that team can escalate its tickets. A user can belong to several teams, which makes backup coverage simple. When an operator acknowledges an alert, everyone can see who is handling it, so two people do not work on the same issue. Owners and administrators configure sources, users, teams and ticketing, and Viewers have read-only access.

See TLE in Action

Schedule a guided walkthrough to see how TLE turns alert streams into clear, actionable decisions.

Request a Demo